学习RL(一)

第二章和第三章

文章通过多臂老虎机的问题来展示强化学习的基本概念。
对于老虎机来讲,有多种操作选择,每一种操作对应的奖励是不同的,我们不知道操作和奖励的对应关系,但是我们手中拥有很多次机会,来对每次的操作进行选择。每次操作完可以立刻看到奖励,但我们不清楚这个操作对应的奖励在整个奖励的分布是最大、最小还是居于中间状态。

基础概念

  • 行动价值(value of action)就是某种行动的价值或者说奖励分数,是一个大于0的实数
  • softmax

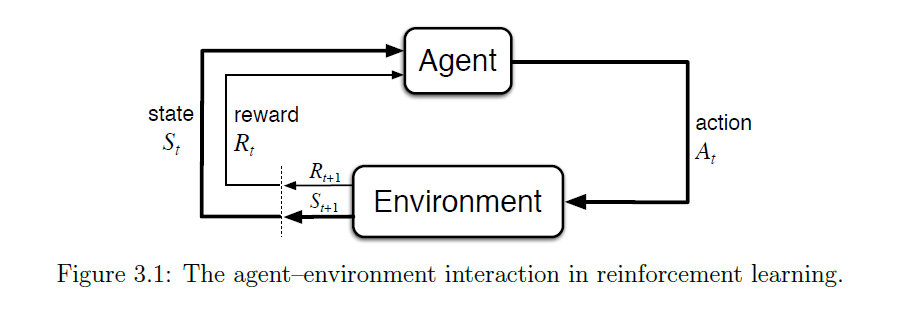
agent-environment

上面的图展示了RL的结构。这个框架比较灵活,actions可以是加载在机械臂电机上的控制电压或者是PWM信号,也可以是高级别的决策,例如是否要变道;states也比较灵活,可以看作是传感器回传的数据,也可以看作是在空间中特定符号描述的物体信息。

  • value functions: 最大的特点是具有迭代属性。
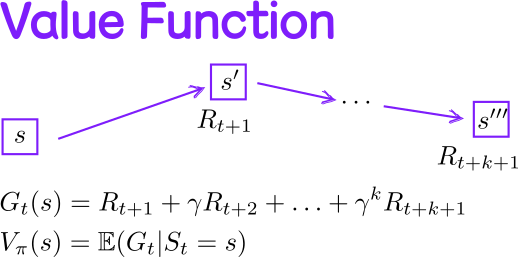
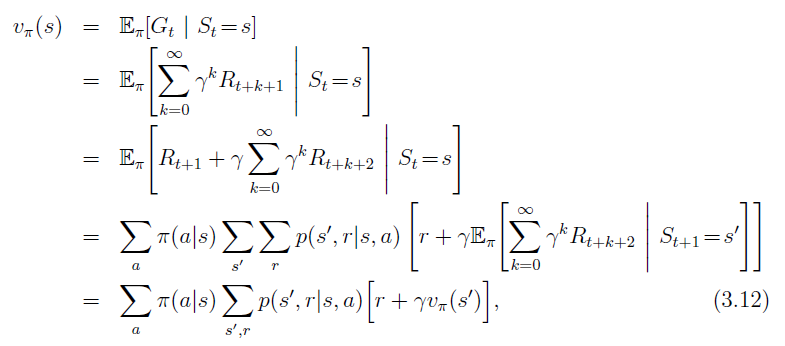
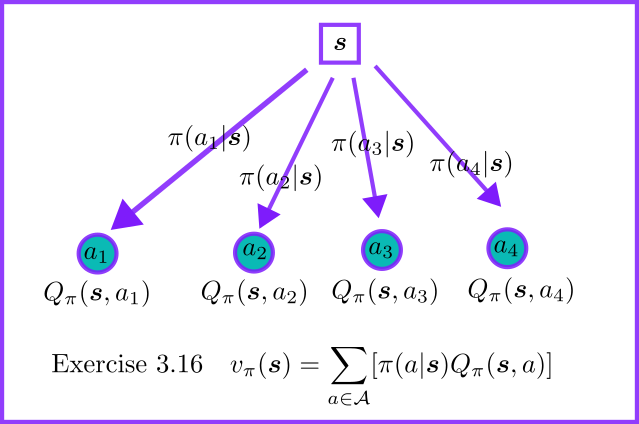
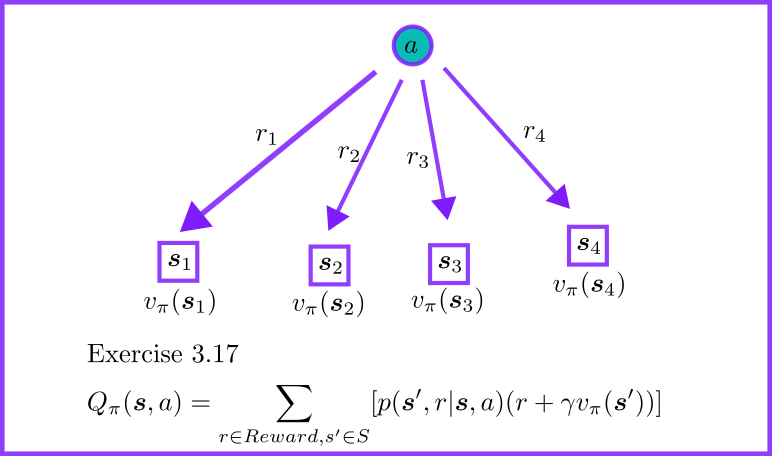
    首先,需要搞清楚value是什么。value是针对当前state而言的,是如果基于这个状态往后迭代很多次(一直到结束)的期望expected return。下面的公式是Bellman公式的定义。
    value function

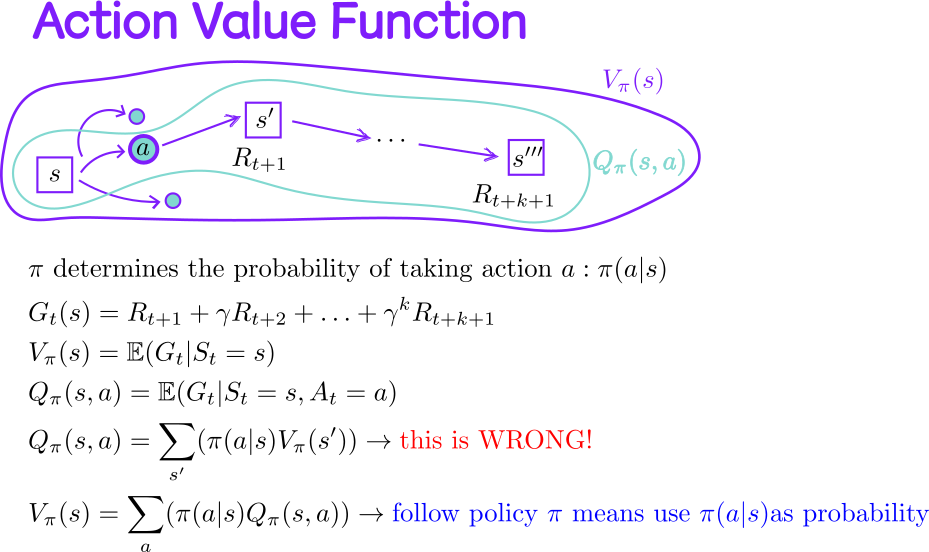
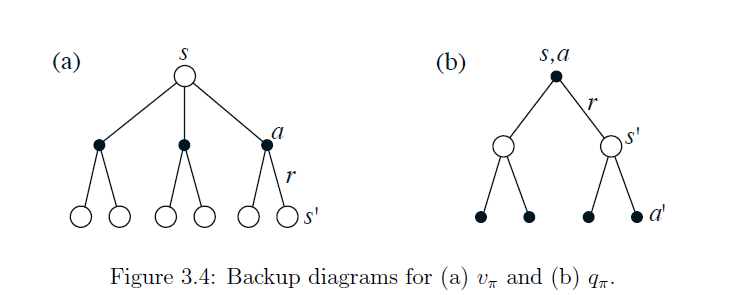
上面的公式的图形化解释,就是下面的图。backup diagrams体现出来一个state的value可以通过后续action和reward倒推出来。那些分叉的树杈就像是求和当中的某一个单项,它们作为基来对最终的value叠加求和。

backup diagrams

Example 3.8 Grid World.

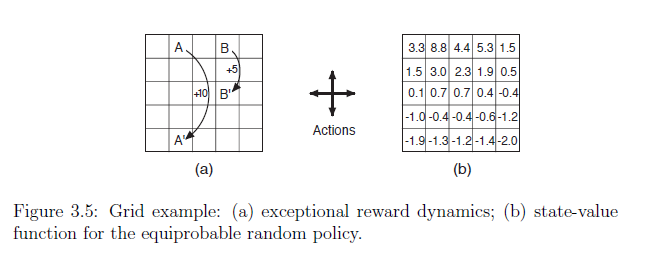
这是一个简单的网格例子,可以用来展示如何利用Bellman公式迭代地计算每一个格子的value。

Grid example from book

文章中提到,格子的value小于10,格子的value大于5,是因为从格子出发到达的在边缘,很容易就掉出格子区域。而格子的value大于5,是因为从格子出发到达的在中间,不容易掉出格子区域。这里的理解就是value的估计其实是一个对后续所有可能性的综合考量,更加接近于人站在当下对未来的局势进行判断,从而估计出当前的态势的取值。

还有需要探究的是value的大小和reward有什么量化的关系呢?

因为是迭代计算,整个公式给出的绝对数据其实只有条件概率和奖励(Reward), 其实我们期望的是在经过尽可能少的迭代计算之后,就可以把最终的value收敛。

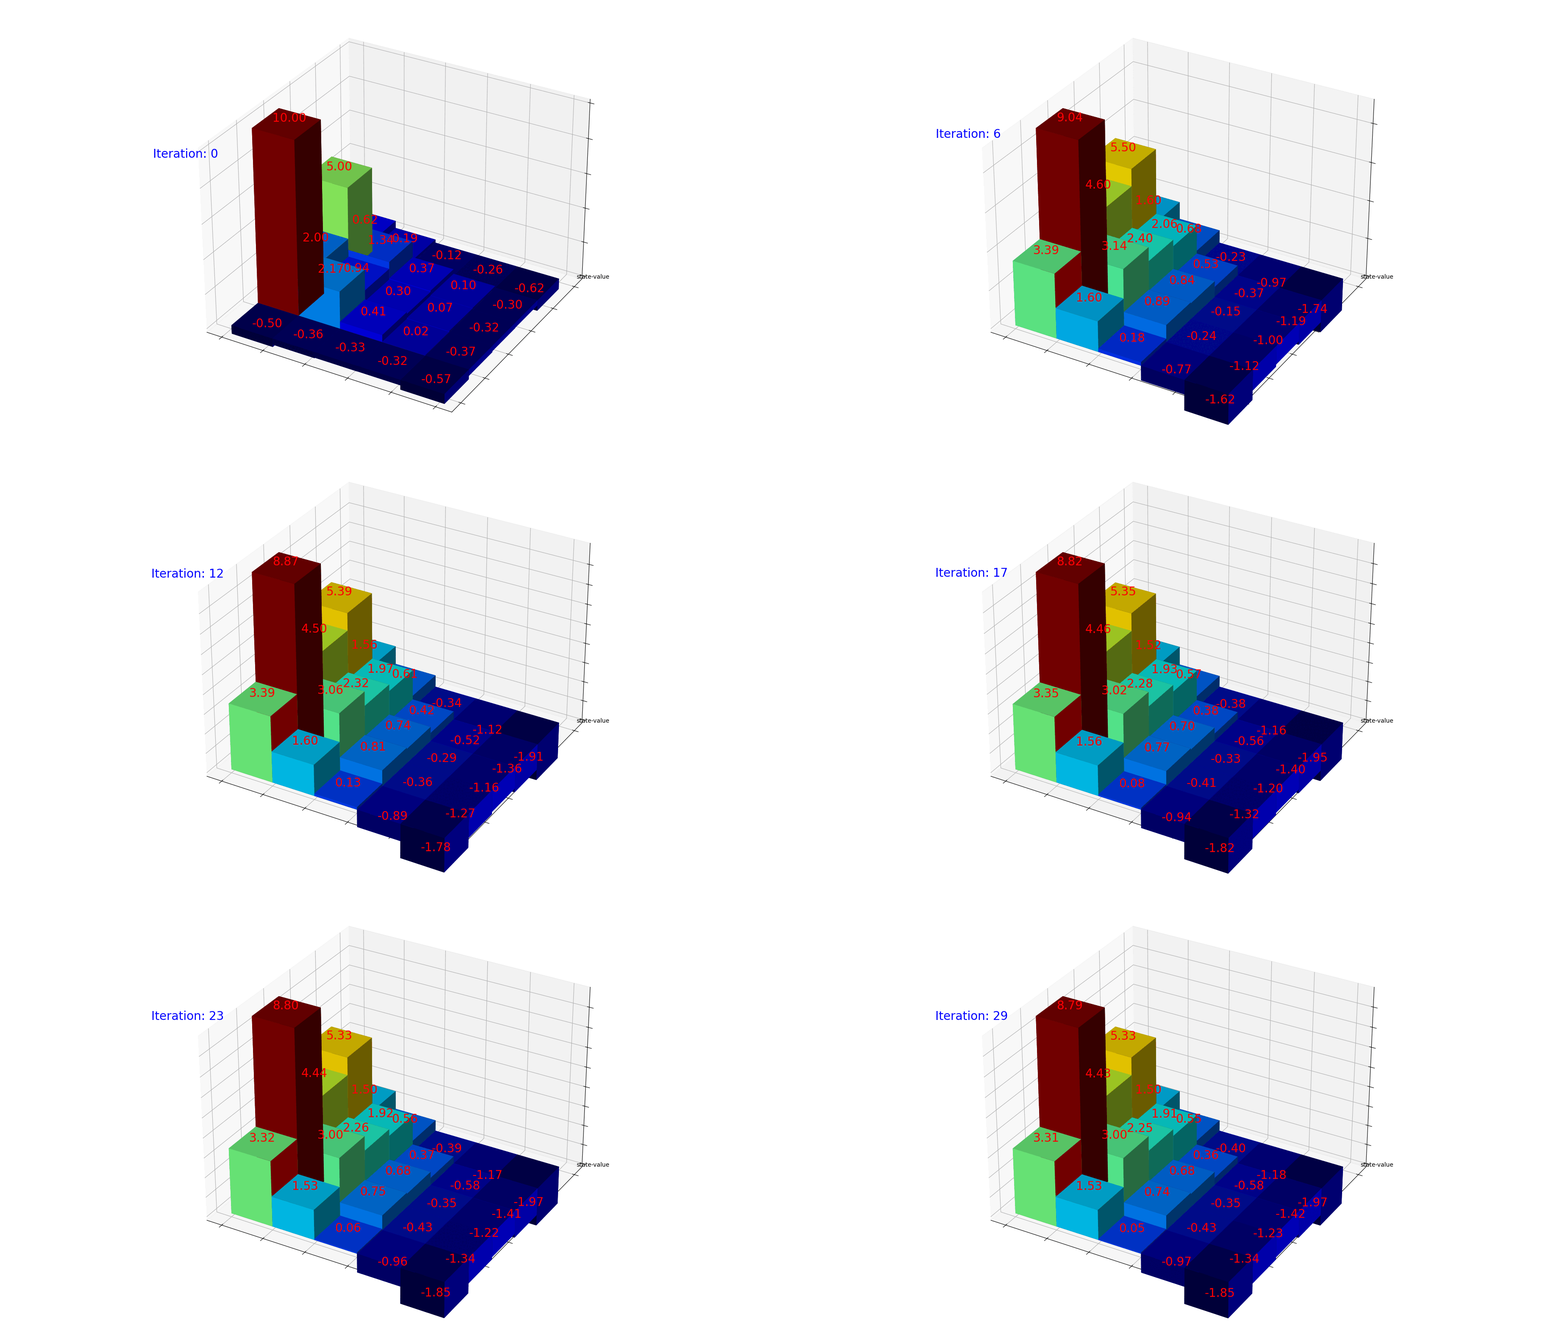
下面的动图是经过30次迭代,每个格子的value的变化走势。可以看到当前的policy下,格子的取值很快就会收敛到稳定。

state-value update for 30 times

python 代码
1
2
3
4
5
6
7
8
9
10
11
12
13
14
15
16
17
18
19
20
21
22
23
24
25
26
27
28
29
30
31
32
33
34
35
36
37
38
39
40
41
42
43
44
45
46
47
48
49
50
51
52
53
54
55
56
57
58
59
60
61
62
63
64
65
66
67
68
69
70
71
72
73
74
75
76
77
78
79
80
81
82
83
84
85
86
87
88
89
import matplotlib.pyplot as plt
import numpy as np
from mpl_toolkits.mplot3d import Axes3D
import matplotlib.animation as animation
import matplotlib.colors as colors
import matplotlib.cm as cm
from matplotlib.animation import ImageMagickWriter

plt.style.use('_mpl-gallery')
N = 5
x = [1,1,1,1,1,2,2,2,2,2,3,3,3,3,3,4,4,4,4,4,5,5,5,5,5]
y = [1,2,3,4,5,1,2,3,4,5,1,2,3,4,5,1,2,3,4,5,1,2,3,4,5]
z = np.zeros(25)

dx = np.ones_like(x)*0.5
dy = np.ones_like(x)*0.5


# params for calculation
gridValues = np.zeros((5, 5))
gamma = 0.9
OutReward = -1
InNormalReward = 0
InSpecialReward_A = 10
InSpecialReward_B = 5
iteration = 30 #different iteration result in different value of gridValues
dz = np.zeros((iteration,25))
initdZ = np.zeros(25)

# prepare data
for num in range(iteration):
for i in range(5):
for j in range(5):
up_grid_value = gridValues[i-1, j] if i > 0 else None
down_grid_value = gridValues[i+1, j] if i < 4 else None
left_grid_value = gridValues[i, j-1] if j > 0 else None
right_grid_value = gridValues[i, j+1] if j < 4 else None
fourBasicDirections = [up_grid_value, down_grid_value, left_grid_value, right_grid_value]
# Bellman Equation
cur_value = 0

if i == 0 and j == 1:
cur_value = cur_value + InSpecialReward_A + gamma * gridValues[4, 1]
elif i == 0 and j == 3:
cur_value = cur_value + InSpecialReward_B + gamma * gridValues[2, 3]
else:
for dir in fourBasicDirections:
if dir == None:
cur_value = cur_value + OutReward + gamma * gridValues[i,j]
else:
cur_value = cur_value + InNormalReward + gamma * dir


cur_value = cur_value / 4.0
gridValues[i, j] = cur_value
dz[num] = gridValues.ravel()

# Plot
fig, ax = plt.subplots(subplot_kw={"projection": "3d"})
fig.set_size_inches(18.5, 10.5)
ax.set(xticklabels=[],
yticklabels=[],
zticklabels=["state-value"])

def update_plot(frame_number, zarray, plot):
# print("frame_number:", frame_number)
plot[0].remove()
bottom = np.zeros_like(zarray[frame_number])
#color
offset = zarray[frame_number] + np.abs(zarray[frame_number].min())
fracs = offset.astype(float)/offset.max()
norm = colors.Normalize(fracs.min(), fracs.max())
color_values = cm.jet(norm(fracs.tolist()))
plot[0] = ax.bar3d(x, y, bottom, 1, 1, zarray[frame_number], color=color_values, shade=True)
# Add numbers on the top of each bar
for text in ax.texts:
text.set_visible(False)

ax.text3D(0, 0, 10, "Iteration: " + str(frame_number), fontsize=20, color='blue')

for each_x, each_y, each_z in zip(x, y, zarray[frame_number]):
label = format(each_z, '.2f')
ax.text3D(each_x + 0.3, each_y + 0.3, each_z + 0.2, label, fontsize=20, color='red')


plot = [ax.bar3d(x, y, z, dx, dy, initdZ, shade=True)]
animate = animation.FuncAnimation(fig, update_plot, iteration, interval=2000, fargs=(dz, plot))
animate.save('state_value.gif', writer=ImageMagickWriter(fps=2, extra_args=['-loop', '1']))
plt.show()

3.8 Optimal Value Functions

强化学习需要关注的是如何寻找到最优的policy,在所有的states下面,找到一个,使得任何一个,都有
记为:

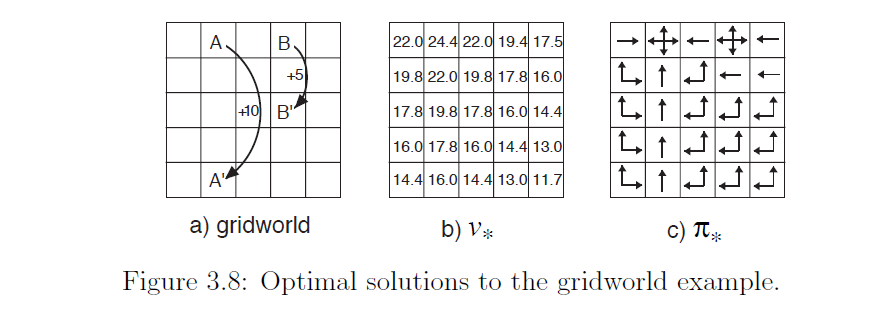
还是以网格世界为例,本章节并没有详细讨论采用什么样的算法来寻找最优的policy,这是后面章节需要讨论的问题,但是直接给出了最优的policy,如下图所示。

网格世界的最优策略

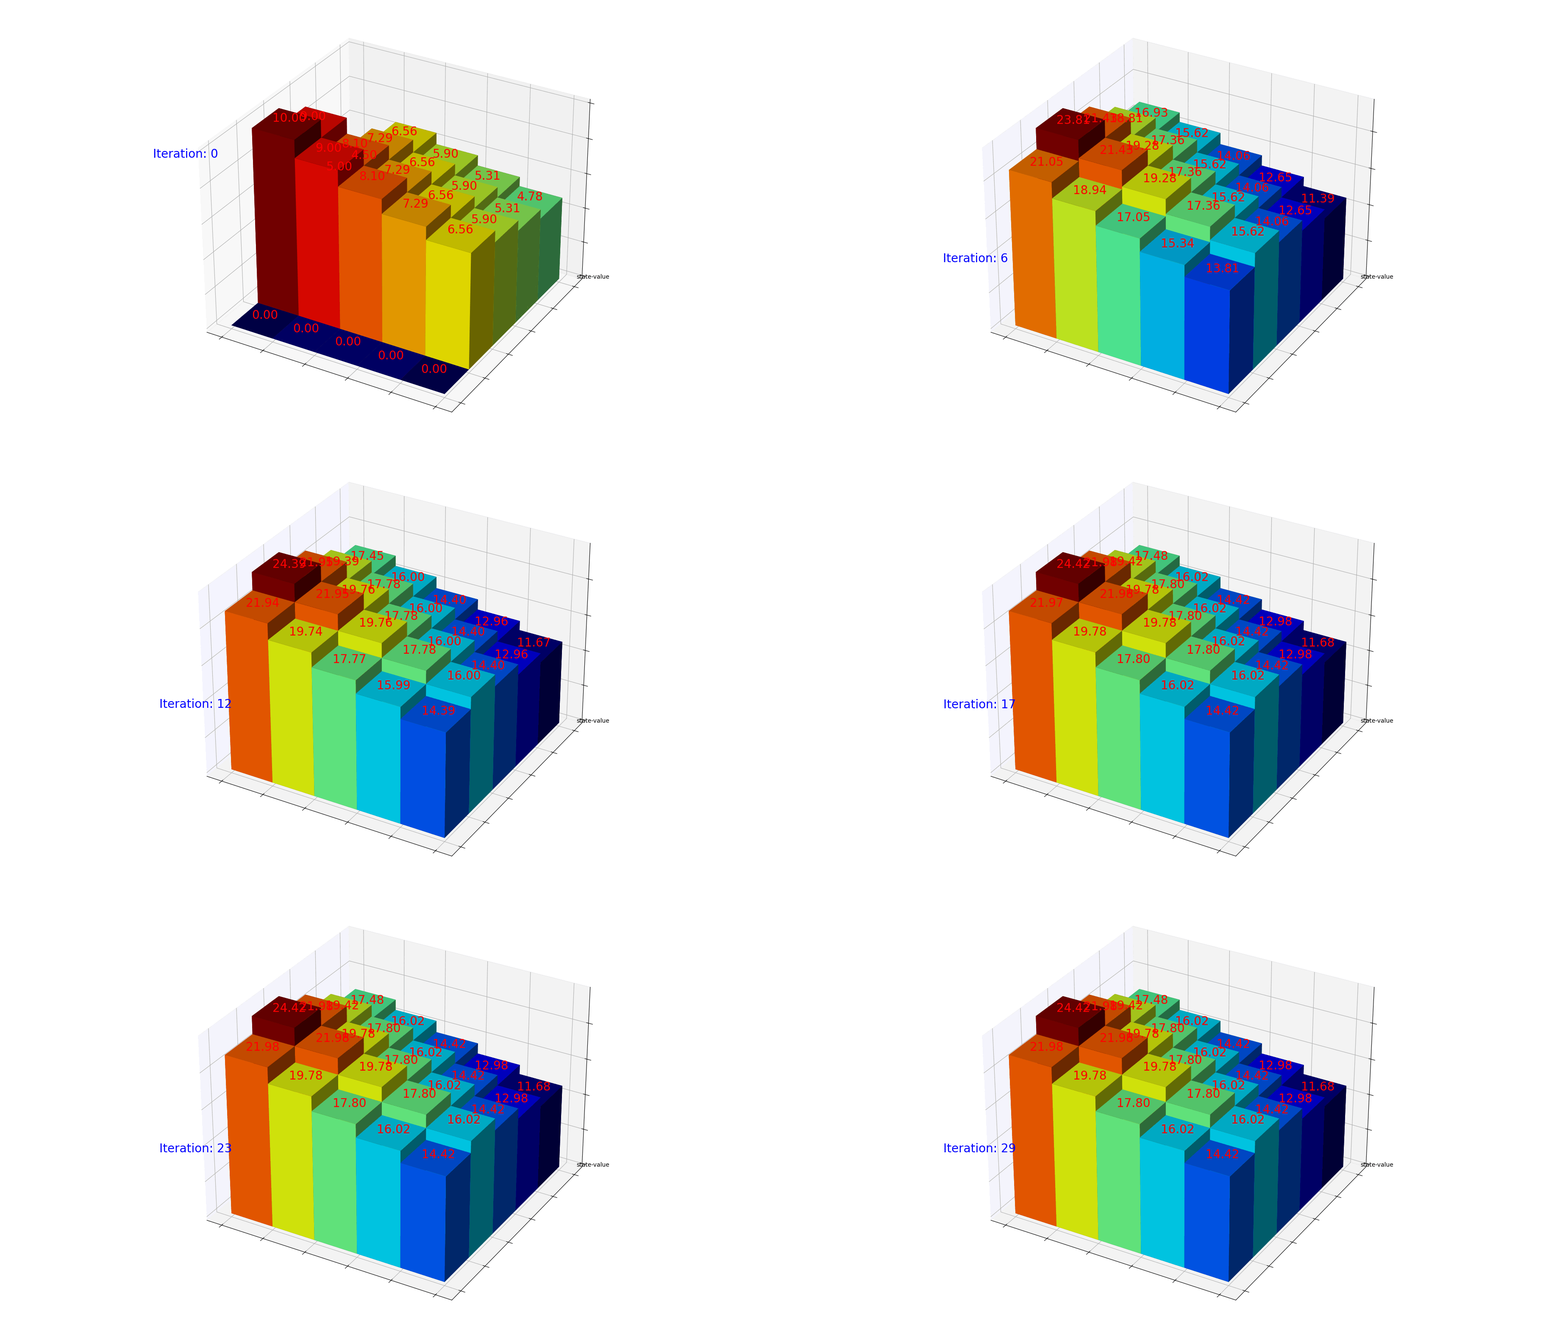
回顾上面的随机策略,当前的最优策略在不同的网格上面,所采取的决策是不同的。为了得到图中b)的结果,对c)的策略进行编码(getOptimalPolicyDirections),利用新的policy来重新计算value

python 代码
1
2
3
4
5
6
7
8
9
10
11
12
13
14
15
16
17
18
19
20
21
22
23
24
25
26
27
28
29
30
31
32
33
34
35
36
37
38
39
40
41
42
43
44
45
46
47
48
49
50
51
52
53
54
55
56
57
58
59
60
61
62
63
64
65
66
67
68
69
70
71
72
73
74
75
76
77
78
79
80
81
82
83
84
85
86
87
88
89
90
91
92
93
94
95
96
97
98
99
100
101
102
103
104
105
106
107
108
109
110
111
112
113
114
115
116
117
118
119
120
121
122
123
124
125
126
127
128
129
130
131
132
133
134
135
136
137
138
139
140
141
142
143
144
145
146
147
148
import matplotlib.pyplot as plt
import numpy as np
from mpl_toolkits.mplot3d import Axes3D
import matplotlib.animation as animation
import matplotlib.colors as colors
import matplotlib.cm as cm
from matplotlib.animation import ImageMagickWriter

plt.style.use('_mpl-gallery')
N = 5
x = [1,1,1,1,1,2,2,2,2,2,3,3,3,3,3,4,4,4,4,4,5,5,5,5,5]
y = [1,2,3,4,5,1,2,3,4,5,1,2,3,4,5,1,2,3,4,5,1,2,3,4,5]
z = np.zeros(25)

dx = np.ones_like(x)*0.5
dy = np.ones_like(x)*0.5


# params for calculation
gridValues = np.zeros((5, 5))
gamma = 0.9
OutReward = -1
InNormalReward = 0
InSpecialReward_A = 10
InSpecialReward_B = 5
iteration = 30 #different iteration result in different value of gridValues
dz = np.zeros((iteration,25))
initdZ = np.zeros(25)


def getOptimalPolicyDirections(row, colunm):
if (colunm == 0):
if(row == 0):
return [0,0,0,1]
elif(row == 1):
return [1,0,0,1]
elif(row == 2):
return [1,0,0,1]
elif(row == 3):
return [1,0,0,1]
elif(row == 4):
return [1,0,0,1]
elif (colunm == 1):
if(row == 0):
return [1,1,1,1]
elif(row == 1):
return [1,0,0,0]
elif(row == 2):
return [1,0,0,0]
elif(row == 3):
return [1,0,0,0]
elif(row == 4):
return [1,0,0,0]
elif (colunm == 2):
if(row == 0):
return [0,0,1,0]
elif(row == 1):
return [1,0,1,0]
elif(row == 2):
return [1,0,1,0]
elif(row == 3):
return [1,0,1,0]
elif(row == 4):
return [1,0,1,0]
elif (colunm == 3):
if(row == 0):
return [1,1,1,1]
elif(row == 1):
return [0,0,1,0]
elif(row == 2):
return [1,0,1,0]
elif(row == 3):
return [1,0,1,0]
elif(row == 4):
return [1,0,1,0]
elif (colunm == 4):
if(row == 0):
return [0,0,1,0]
elif(row == 1):
return [0,0,1,0]
elif(row == 2):
return [1,0,1,0]
elif(row == 3):
return [1,0,1,0]
elif(row == 4):
return [1,0,1,0]

# prepare data
for num in range(iteration):
for i in range(5):
for j in range(5):
up_grid_value = gridValues[i-1, j] if i > 0 else None
down_grid_value = gridValues[i+1, j] if i < 4 else None
left_grid_value = gridValues[i, j-1] if j > 0 else None
right_grid_value = gridValues[i, j+1] if j < 4 else None
fourBasicDirections = [up_grid_value, down_grid_value, left_grid_value, right_grid_value]
# Bellman Equation
cur_value = 0
directionNum = 0
if i == 0 and j == 1:
cur_value = cur_value + InSpecialReward_A + gamma * gridValues[4, 1]
elif i == 0 and j == 3:
cur_value = cur_value + InSpecialReward_B + gamma * gridValues[2, 3]
else:
for dirIndex in range(4):
directionNum = directionNum + getOptimalPolicyDirections(i, j)[dirIndex]
if (fourBasicDirections[dirIndex] == None):
cur_value = cur_value + (OutReward + gamma * gridValues[i,j]) * getOptimalPolicyDirections(i, j)[dirIndex]
else:
cur_value = cur_value + InNormalReward + gamma * fourBasicDirections[dirIndex] * getOptimalPolicyDirections(i, j)[dirIndex]
if directionNum > 0:
cur_value = cur_value / directionNum
gridValues[i, j] = cur_value
dz[num] = gridValues.ravel()

# Plot
fig, ax = plt.subplots(subplot_kw={"projection": "3d"})
fig.set_size_inches(18.5, 10.5)
ax.set(xticklabels=[],
yticklabels=[],
zticklabels=["state-value"])

def update_plot(frame_number, zarray, plot):
plot[0].remove()
bottom = np.zeros_like(zarray[frame_number])
#color
offset = zarray[frame_number] + np.abs(zarray[frame_number].min())
fracs = offset.astype(float)/offset.max()
norm = colors.Normalize(fracs.min(), fracs.max())
color_values = cm.jet(norm(fracs.tolist()))
plot[0] = ax.bar3d(x, y, bottom, 1, 1, zarray[frame_number], color=color_values, shade=True)
# Add numbers on the top of each bar
for text in ax.texts:
text.set_visible(False)

ax.text3D(0, 0, 10, "Iteration: " + str(frame_number), fontsize=20, color='blue')

for each_x, each_y, each_z in zip(x, y, zarray[frame_number]):
label = format(each_z, '.2f')
ax.text3D(each_x + 0.3, each_y + 0.3, each_z + 0.2, label, fontsize=20, color='red')


plot = [ax.bar3d(x, y, z, dx, dy, initdZ, shade=True)]
animate = animation.FuncAnimation(fig, update_plot, iteration, interval=2000, fargs=(dz, plot))
animate.save('state_value.gif', writer=ImageMagickWriter(fps=2, extra_args=['-loop', '1']))
plt.show()


最优策略下的计算过程


学习RL(一)
https://warden2018.github.io/2024/07/26/2024-07-26-RL_1/
作者
Yang
发布于
2024年7月26日
许可协议